COVID-19 Impact on Job Vacancies
Job vacancies decreased by 43.2%, or by 98,200 vacancies in the three months to May 2020 (seasonally adjusted). A fall of this scale is unprecedented in the history of the series, and reflect the impacts of the COVID-19 pandemic and the associated restrictions on people and businesses, most of which were still in effect on Friday 15 May 2020 (the survey reference date).
The Job Vacancies series, which began in May 1979, enables direct comparisons of the impact of COVID-19 on job vacancies with earlier economic shocks, such as the recessions of the 1980s and 1990s. The survey was unfortunately suspended for five quarters during the Global Financial Crisis.
As can be seen in the chart below, the current pandemic has resulted in a much steeper decrease in job vacancies than previous downturns measured by the Job Vacancies series. Based on other leading indicators such as job advertisements series, the downturn is also much steeper than what is expected would have been measured by the series during the Global Financial crisis, had it not been suspended at this time. The largest single quarter decline in the 1980s recession was 18.6% (in May 1982) and was 26.7% in the 1990s recession (in November 1990).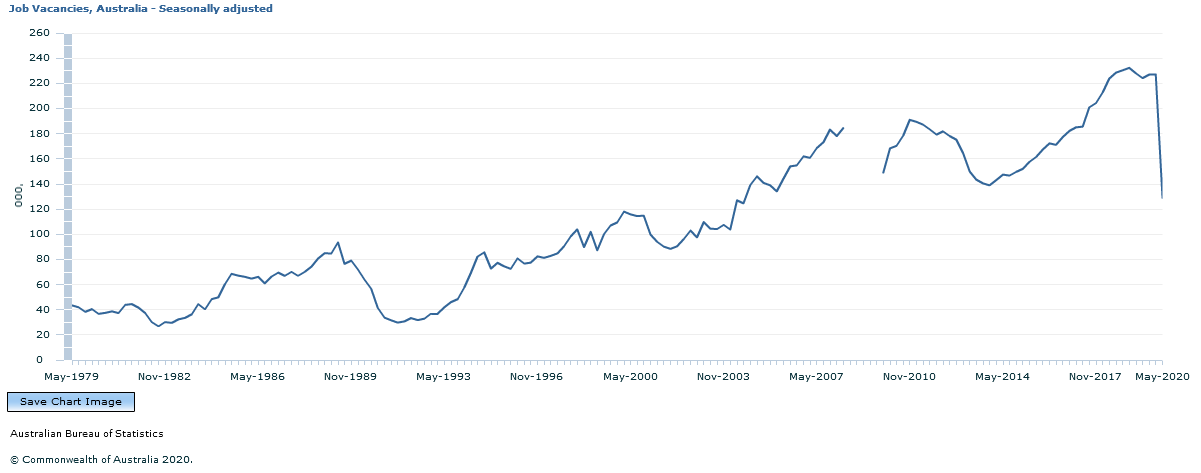
Source(s): Job Vacancies, Australia (cat. no. 6354.0)
All states and territories recorded substantial decreases in job vacancies in May 2020. The fall was greatest in Victoria (down 51.9%) and lowest in Queensland (down 34.3%) in original terms.
Source(s): Job Vacancies, Australia (cat. no. 6354.0)
The impact was more pronounced in the private sector, which fell by 45.0% (in seasonally adjusted terms), compared to a 28.9% decrease in the public sector. Over a quarter of public sector job vacancies in May 2020 were in the Health care and social assistance industry.
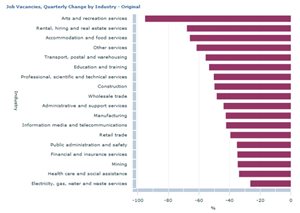
Services industries that were exposed to COVID-19 social distancing restrictions showed corresponding large decreases in job vacancies. Arts and recreation services recorded a 95.2% drop in vacancies (in original terms), reflecting the closures of venues such as casinos, theatres, fitness centres, sporting grounds and zoos, and cancellations of events due to social distancing requirements. The next greatest decreases in job vacancies were seen in Rental, hiring and real estate (67.9%) and Accommodation and food services (65.9%).
Electricity, gas, water and waste services saw the smallest percentage decrease in job vacancies in the May quarter, partly reflecting increased demand for waste collection, disposal, and associated cleaning services.
All industries in scope of the survey recorded decreases in job vacancies in both quarterly and annual terms.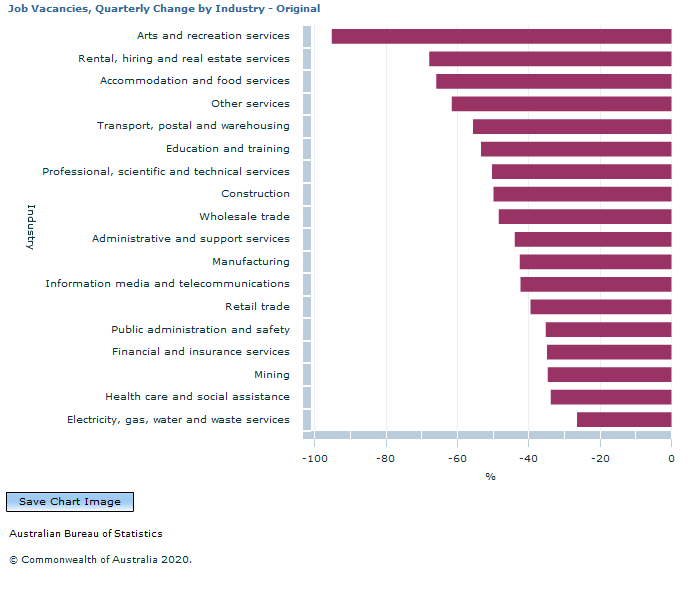
Source(s): Job Vacancies, Australia (cat. no. 6354.0)
While not a standard output from the survey, a measure of how many businesses reporting any vacancies also shows the extent of the acute reduction in labour demand in May 2020. A smaller proportion of businesses reported any job vacancies in May 2020 (6.5%), compared with either the previous quarter (11.0%) or the same time last year (11.9%). It is important to remember that most small businesses usually report zero vacancies, and they represent the vast majority of businesses in the Australia.
|
PROPORTION OF BUSINESSES REPORTING VACANCIES |
|||
|
|
May 2019 |
Feb 2020 |
May 2020 |
|
Mining |
9.6% |
20.9% |
8.3% |
|
Manufacturing |
10.8% |
8.0% |
4.4% |
|
Electricity, gas, water and waste services |
9.9% |
10.2% |
11.8% |
|
Construction |
12.0% |
13.6% |
4.6% |
|
Wholesale trade |
12.9% |
14.6% |
14.1% |
|
Retail trade |
15.3% |
13.3% |
9.7% |
|
Accommodation and food services |
15.2% |
14.5% |
2.3% |
|
Transport, postal and warehousing |
8.0% |
5.3% |
4.1% |
|
Information media and telecommunications |
13.0% |
14.0% |
7.0% |
|
Financial and insurance services |
3.0% |
4.5% |
5.0% |
|
Rental, hiring and real estate services |
10.5% |
6.9% |
4.1% |
|
Professional, scientific and technical services |
13.2% |
9.4% |
9.2% |
|
Administrative and support services |
13.9% |
16.5% |
7.8% |
|
Public administration and safety |
21.1% |
31.3% |
22.6% |
|
Education and training |
11.8% |
7.5% |
4.0% |
|
Health care and social assistance |
12.3% |
8.2% |
6.5% |
|
Arts and recreation services |
4.4% |
3.4% |
0.5% |
|
Other services |
8.6% |
10.6% |
5.6% |
|
All Industries |
11.9% |
11.0% |
6.5% |
Job vacancies statistics are a measure of unmet demand for labour within the economy. They are used as a leading indicator of employment growth, with changes in job vacancies often preceding changes in a range of labour market indicators. The current drop in labour demand, driven by restrictions to halt the spread of COVID-19, has been unusually sudden in its onset and its relationship with other indicators is likely to be different during this period.
For more information, email [email protected].
![]()
